
The Plan, based on the Answers
[The problem] – It is time consuming and difficult to measure wildlife in the wild. Colored leg bands on birds’ legs, and “chirping” radio tags on larger wildlife are the current state of the art. However, they provide only periodic glimpses of wildlife movements within a confined area and offer little opportunity to measure anything beyond a presence of a small sample of animals in a habitat. [Whose problem?] – Animal psychologists, wildlife conservationists, and others who research wildlife need a better/faster/cheaper solution for monitoring wildlife. Ranchers and farmers might have similar needs to track their livestock. Looking at tagging humans, retailers may have analogous problems tracking the behaviors of shoppers in their stores. Urban planners, too, might want to track the flow of people around cities. [An important problem?] – Deforestation and other human activities along with climate change and other natural phenomenon are having an impact on wildlife and their habitat. Bird Watch can measure the impact on wildlife, and help us better understand the short-term and long-term implications of these changes. [The solution] – It is time consuming and difficult to measure wildlife in the wild. Bird Watch is a technology solution which uses ultra-low powered radios, embedded into thumbnail-sized “tags,” plus a set of battery-operated “base stations” which are deployed within the measurement area. The tags are small enough to be attached to the animals, and sufficiently low-cost so as to be disposable. The base stations are tied to trees or staked into the ground, and store the tag identifier and timestamp, along with the all data captured by the tags, whenever the tags get within range. Tags can monitor movement, temperature and pressure. As a system, the location and movement of a large number of wild animals can be monitored 24 hours per day, 7 days per week without the need of visiting the site more than twice (once to set up the base stations and tag the animals, and again at the end of the research period to collect the base stations). [The buyer] – Animal psychologists and wildlife conservationists typically make their own decisions on the products and technologies they use. [Is the product ready to ship?] – A few hundred tags have been built and deployed, along with a few dozen base stations. These were built in small-batches at commercial-grade. The cost to do that was exorbitant, but the product has been field-tested, and other institutions are now interested in this product. Thus, the current features seem to be at or above the MVP stage and the product is ready to go. [Market size, Top-down model] – There are 80 active wildlife researchers in the United States. On average, each wildlife research project would require 100 tags and 20 base stations. (Note that this product has two components: tags and base stations). There are no equivalent products in the market today, and thus it is reasonable to assume 5% market share after 1 year and 50% market share after 3 years.After 1 year:
80 researchers x 100 tags x 5% market share = 400 tags.
80 researchers x 20 base stations x 5% share = 80 base stations.
After 3 years:
80 researchers x 100 tags x 50% market share = 4000 tags.
80 researchers x 20 base stations x 50% share = 800 base stations.
Total market need:
80 researchers x 100 tags = 8,000 tags.
80 researchers x 20 base stations = 1,600 base stations.
After 1 year:
400 tags @ $25/ea = $10,000.
80 base stations @ $150/ea = $12,000.
Total = $22,000.
After 3 years:
4,000 tags @ $25/ea = $100,000.
800 base stations@ $150/ea = $120,000.
Total = $220,000.
Total opportunity size:
8,000 tags @ $25/ea = $200,000.
1,600 base stations@ $150/ea = $240,000.
Total = $440,000.
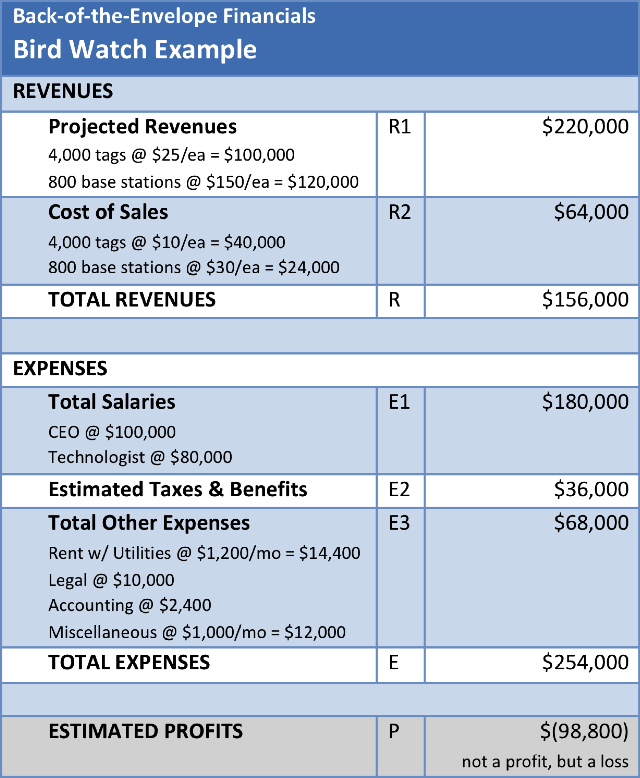
Critique
Oh dear, the back-of-the-envelope says this company, with the estimated revenues from year 3, is not profitable. This, despite the team only consisting of two people (noting I removed the sales person from the original estimated team), and with a very lean set of expenses.
If your plan has the same flaw, there are a few options for trying to fix it. And even if your plan is profitable, it is often worth the effort to iterate and revise your plan. First, go back to the market in Chapter 10. Are there other potential customers with similar problems in unrelated markets? Second, go back to the pricing in Chapter 11. Will the customers pay more than you estimated? Third, is your “cost of sales” as low as possible? In the Bird Watch example above, the tags cost the company $10 each. Is there any alternative technology that could drop that to $5? What would it take to drop the cost to $1?
If after all these iterations, the plan is still not profitable, or if the only way to get to profitability is to push the assumptions so far as to be unbelievable (e.g. 90% of potential customers will buy your product), then the plan is truly flawed and it should not be pursued until something significant changes to make it potentially profitable.
Rather than giving up on this plan, let’s go all the way back to the problem. Let’s “pivot” our solution to focus on a different market, and see what happens:
A Pivot to a new plan
[The problem – pivot] – In the process of raising chickens, turkeys, ducks and other poultry on modern farms, a significant number of birds die before reaching maturity. It is time consuming and difficult for poultry farmers to measure the living conditions of their birds, to determine the cause of these deaths. [Whose problem? – pivot] – Poultry farmers lose money when their birds die before they are ready to be sold at market. [An important problem? – pivot] – Birds are unnecessarily suffering on today’s modern poultry farms. Improving the quality of these animals’ lives is very much a worthwhile goal. [The solution – pivot] – It is time consuming and difficult to measure the living conditions of birds on a poultry farm. Bird Watch is a technology-based solution which uses ultra-low powered radios, embedded into thumbnail-sized “tags,” plus a set of battery-operated “base stations” which are deployed every 100-1,000 square meters within the measurement area. The tags are small enough to be attached to the animals, and sufficiently low-cost to be disposable, although expensive enough that only a small portion of the birds within a flock would be tagged. The base stations are also battery operated, easily disbursed around the barn and elsewhere around the farm. When a tag comes within range of a base station the tag identifier and timestamp is transferred to the base station, along with other data captured by the tags. Tags can monitor movement, temperature , pressure, sound levels, and light levels. As a system, once the birds are tagged and the base stations installed, the location and movement of the tagged birds can be monitored on a 24/7 basis without human involvement. [The buyer – pivot] – The people choosing to buy the Bird Watch system are likely the owners of the poultry farms, who have a strong financial interest in minimizing premature animal deaths on their farms. [Is the product ready to ship? – pivot] – While Bird Watch has been tested in the field by animal psychologists measuring wild birds, it has not been used by poultry farmers measuring domesticated birds. There are very likely minor changes required to meet the needs of these new customers. [Market size, Top-down model – pivot] – According to the United States Department of Agriculture (USDA), in 1995 there were 49,716 poultry farms in the United States. In 2010, 8.3 billion chickens and 244 million turkeys were raised in the United States. Of those animals, 107 million chickens died prematurely, plus an unreported number of turkeys. If Bird Watch were used to measure just 0.001% of the total birds, 85,440 tags per year would be required. If 10 base stations were installed on just 2% of those farms, 9,940 base stations would be required. [Market size, Bottom-up model – pivot] – Without further market research, the expected market share of Bird Watch in the poultry farming market can not accurately be estimated. To help justify the above model, it is useful to create a bottom-up market size estimate.After 1 year:
25 farms x 100 tags = 2,500 tags.
25 farms x 10 base stations = 250 base stations.
After 3 years:
1,000 farms x 100 tags = 100,000 tags.
1,000 farms x 10 base stations = 10,000 base stations.
Total market need:
50,000 farms x 1000 tags = 50,000,000 tags.
50,000 farms x 50 base stations = 2,500,000 base stations.
Nicely, the top-down and bottom-up models for year 3 are sufficiently close to believe that these estimates are reasonable first draft values. Further customer discussions and other market research are needed to validate these estimates further.
[Pricing – pivot] – The goal is to make the tags as low-price as possible. In year one, the tags will be priced at $25 each and the base stations $150 each. By year 3 the goal is to price the tags at $10 each and the base stations at $100 each, with a cost of $5 and $25 respectively. At full scale, the tags should be priced at no more than $5, and the base stations can continue to be priced at $100. [Opportunity size – pivot] – Multiplying the market size by the pricing:After 1 year:
2,500 tags x $25/ea = $62,500.
250 base stations x $150/ea = $37,500.
Total = $100,000.
After 3 years:
100,000 tags x $10/ea = $1,000,000.
10,000 base stations x $100/ea = $1,000,000.
Total = $2,000,000.
Total opportunity size:
50,000,000 tags x $5/ea = $ 250,000,000.
2,500,000 base stations x $100/ea = $ 250,000,000.
Total = $500,000,000.
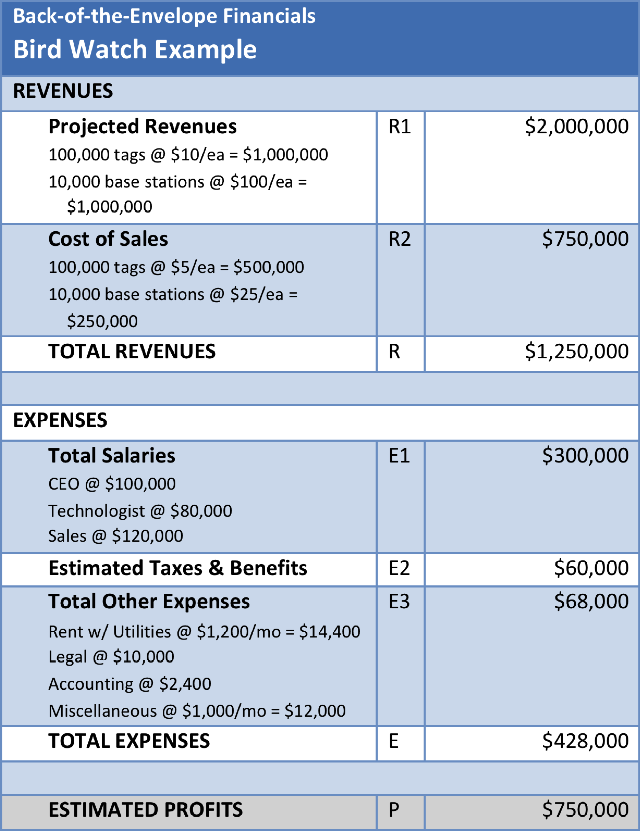
Critique
The Bird Watch financials in this iteration show a profit! And there is a sufficient profit that in the more detailed financial plan, additional team members could be added, the price of the tags adjusted, or other necessary adjustments made.
The point of the back-of-the-envelope financials is simply to show that the business might be profitable, and the above table does that quite well. Well enough that this plan seems reasonable to move forward into details financials and the remainder of the business planning process.