
Seven years into guiding new entrepreneurs through the thicket of issues between idea and success, I’ve found quite a few common pitfalls and areas where common knowledge is less common than I had thought.
The biggest of these is accounting, or more specifically, how to keep track of sales, customers, and everything else.
This isn’t at all difficult, it’s just not a topic taught in school and thus a simple set of ideas that most people never come across in their lifetime. It begins with a list. Whether you are tracking the flow of money in and out of the business, or the flow of products or services, you begin by making a list.
Let’s actually do this. Let’s create a list of all the transactions a typical business might see for a month and see how easy this process really is. Fire up your favorite spreadsheet and make a list with these columns: Date, Type, Description, Vendor, In, Out, Balance. Accountants would call this list a “general ledger“. It’s a fancy name that just means a list of transactions.
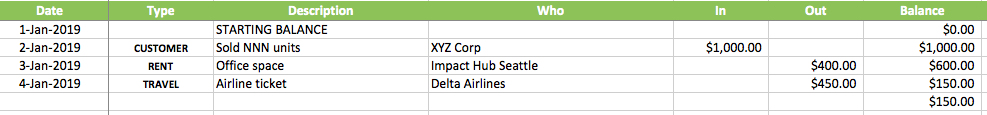
The first line is special, it’s there to give us a starting balance. In the above example, we start with $0. If you have money in your corporate bank account, then fill that in instead.
The rest of the lines are the various deposits and expenses that happen when you run a company.
- Date. The date the transaction occured.
- Category. I’ll explain this later, it’s the reason we are doing this in a spreadsheet instead of on paper.
- Description. This lets you remember why this transaction took place, and just need to be enough to remind you a year or two later when you are reviewing what’s been happening in your business.
- Who. Who paid you or who did you pay. This again is here to help you remember what happened. We’ll track the customers in a separate tab later.
- In. If the money was paid to your company, enter the amount here. Accountants would call this a “credit”. I’m not an accountant so I use English.
- Out. If your company paid money, then enter the amount here. Accountants would call this a “debit”.
- Balance. This is a formula. It’s the value from the previous line, plus any value from the row in the In column, minus any value in the Out column. It’s up to you to ensure only one of the In or Out columns has a value. No transaction should have both.
Every time money comes in or out of your company you enter a line in your ledger. If you follow that simple rule, you’ll know how much money your company has left, even when it takes a while for payments to vendors to show up in your bank statements and even when your bank puts a hold on your deposits. Or the same if you are running your business in part out of a bank account and in part from a cashbox, a mobile money account, or like my company, spread across multiple bank accounts.
Just keeping up with the ledger will help you with your accounting, but the real benefit comes from the Category column. In the above example, the payment from a customer is categorized as CUSTOMER and the payments for rent and travel are categories as RENT and TRAVEL. You can create whatever categories fit your business. I always use all caps for the categories and I often use abbreviations.
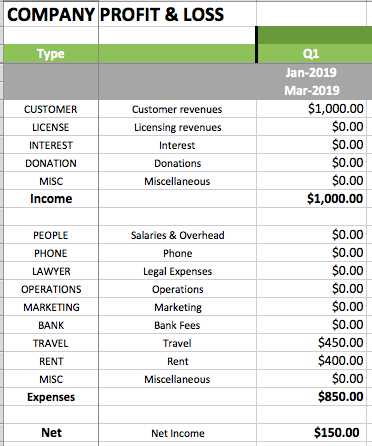
The purpose of the categories is to create a summary of the transactions. Above is an example summary from the three transaction in the example ledger. The summary is split into a two sections. At the top are a variety of categories for income. A the bottom are a variety of categories for expenses. Again, you can change these, add more, and customize the categories to fit your business.
The totals are computed automatically using the =SUMIF() formula built into Excel and Google Sheets. SUMIF is the magic that turns the list of transactions into something of much greater value. The formula looks complicated if you’ve never used it before, but it’s actually rather simple.
=SUMIF(Ledger!$B$3:$B$9999,$A6,
Ledger!$E$3:$E$9999)
SUMIF takes: (i) a range, (ii) a value, and (iii) another range.
The (i) first range is the column with the categories. In my spreadsheet I’ve named my first tab “Ledger” and my categories are in column B, so my SUMIF begins with Ledger!$B$3:$B$9999, which translates to “the tab named Ledger and rows 3 through 9999 in column B”.
The (ii) value is the category to match. I could type in the category name in quotes, but the category is visible on my summary tab, so I just enter the name of the cell. For the first row, that is $A6. In the next row that would be A7, then A8, and so forth.
The (iii) last range is the column with the values. In my ledger, the column labeled In is column E, so my SUMIF ends with Ledger!$E$3:$E$9999, which translates to “the tab named Ledger and rows 3 through 9999 in column E”. For the categories that are adding expenses, the SUMIF formula ends with Ledger!$F$3:$F$9999, as the Out column is column F
What are all the $’s for? They are there to tell the spreadsheet not to change those values when the formula are copied and pasted between cells. Normally spreadsheets automatically update the row and column names when you copy a formula from cell to cell. If you don’t include the $ then as you copy the summary formula down from row to row the SUMIF will change from rows 3-9999 to rows 4-10000 to rows 5-10001, etc. and the sums will not add up correctly.
All of this work looks rather mundane at this point, but add in some more transactions and the magic begins to appear.
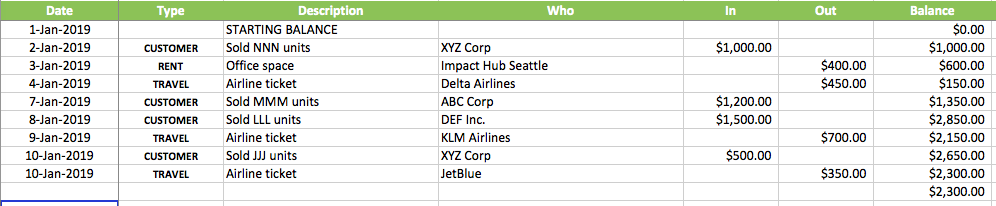
Above I added five more transactions, three more sales to customers and two more airline tickets.
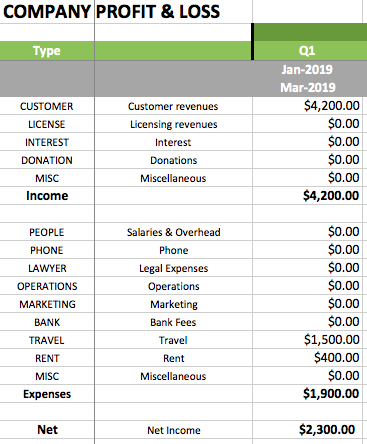
Above you can now see some magic happening. By switching to the summary tab you can see that the total income is $4,200, the total expenses are $1,900, that $1,500 of those expenses are travel, and that the company is running with a net income, not a net loss.
And if you know something about accounting, you’ll recognize this summary as the income statement, a.k.a. the profit & loss statement or simply the P&L. If you didn’t know that term, now you know it’s nothing more than a summary of the income and expenses, plus one formula at the bottom (a.k.a the bottom line) that subtracts the total expenses from the total income.
All that is quite helpful, but even better is when you reuse this basic idea to keep track of your customers.
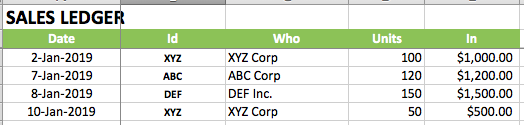
Make a third tab in your spreadsheet, this time with columns for the Date, a customer Id, Name, Units, and Money. Above is my spreadsheet. I made it by making a copy of the General Ledger, removing the Description, Out, and Balance columns, removing the rows related to expenses, changing Category to Id, and assigning an Id to each of the customers.
Now whenever you make a sale, you create two entries in the spreadsheet, one on the general ledger to track and money and a second on the sales ledger to track the customer, number of units sold, and the money. If you have other valuable information to record, add more columns.
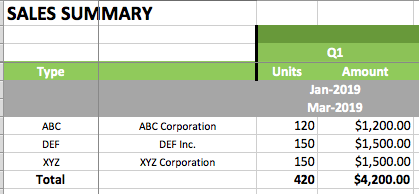
With the sales ledger in place you can make a fourth tab with a sales summary. This again uses the =SUMIF() formula to add up the values from the ledger, this time summing each of the units and currency columns, using the Id’s you assigned to each customer. The reason I use Id’s instead of just relying on the customer names is that it is decreases the odds of mistakes, mistyping a name, adding an extra space, forgetting a period, etc.
In the above example, you can see a bit of the magic peeking through. There were two sales to XYZ Corporation totaling 150 units and $1,500. That is not terribly difficult to see in the ledger when there are just four entries, but after 1,000 sales you’ll not be able to keep all the information in your head. At 100 customers or 1,000 sales you’ll likely not be able to tell me your five largest customers, or more importantly, the five largest customers of last quarter.
And we’ll end on that topic, how to make these summaries summarize by quarter (or any other date range). For that you have to learn just one more formula, =SUMIFS(), which is little more than =SUMIF() with more than one criteria to match.
=SUMIFS(Ledger!$E$3:$E$9999,
Ledger!$B$3:$B$9999,$A6,
Ledger!$A$3:$A$9999,”>=”&C$4,
Ledger!$A$3:$A$9999,”<=”&C$5)
Two tricks to deal with SUMIFS, the first is to note that the order of the values is different than SUMIF. The column to be summed comes first, then the columns with the values to match, the value to match, another set of columns to match, another value to match, and so on. The above formula is the formula in my P&L summary tab for the first category of income.
If you scroll back to my example P&L, you’ll see two gray rows, each with a date. These happen to specfify Q1 of 2019, January 1, 2019 and March 30, 2019. For your business maybe weeks or months are more useful. Either way the “>=”&C$4 and “<=”&C$5 in the SUMIFS tells the spreadsheet to match the entries whose dates are between the start and end dates. I did a bit of googling to learn how to do that.
What I’m not showing in the above screen shots is that all my summary tabs are divided into quarters and years. And I really do use this format for my own business. I can thus see the latest (and past) P&Ls for my company by just opening the spreadsheet and flipping to the P&L tab. I find that a lot simpler than dealing with Quickbooks or any other accounting software, especially as that same spreadsheet has a series of other ledgers and summary tabs that I built to let me see every other aspect of my business, again simply by flipping from tab to tab.
And I can’t stress enough the importance of keeping track of what’s happening in your business. Take an hour or two to set this up for yourself, take a few minutes each day to enter the daily transactions, and you’ll never go back to however you are doing this today. With a list and a summary, you too can understand how the money is flowing in your business, how sales are doing this month vs. last month, and help you understand why
Image from Flickr