An oft-repeated phrase before an economic or market-based bubble bursts is “this time is different”. A few months ago I asked what the consequences of the Federal Reserve printing $8 trillion. Best anyone can say is that the one clear result of that is a highly inflated stock market.
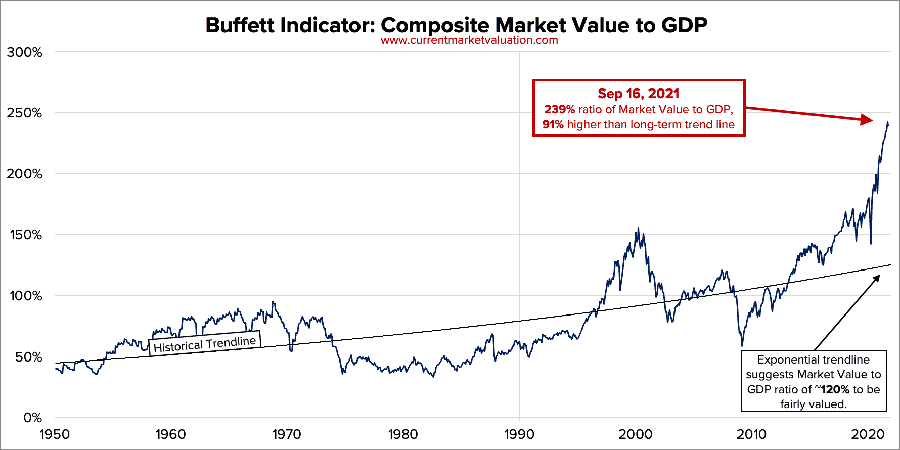
I stumbled upon the Current Market Valuation website to find all these graphs. Above is Warren Buffet’s favorite market metric: total U.S. market value divided by U.S. GDP. All time historic high… by quite a lot.
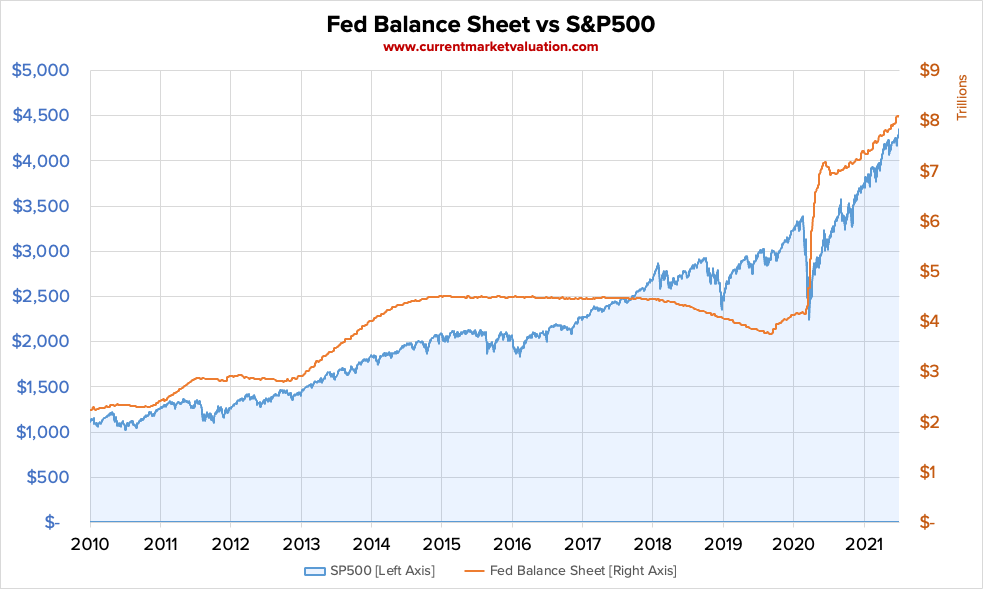
A clearer graph showing the correlation of Federal Reserve printing money vs. the stock market is above. The vertical line in 2020 was $2 trillion created after the stock exchanges crashes more than they ever had in history, with larger one-day drops than the former historic crash of 1929.
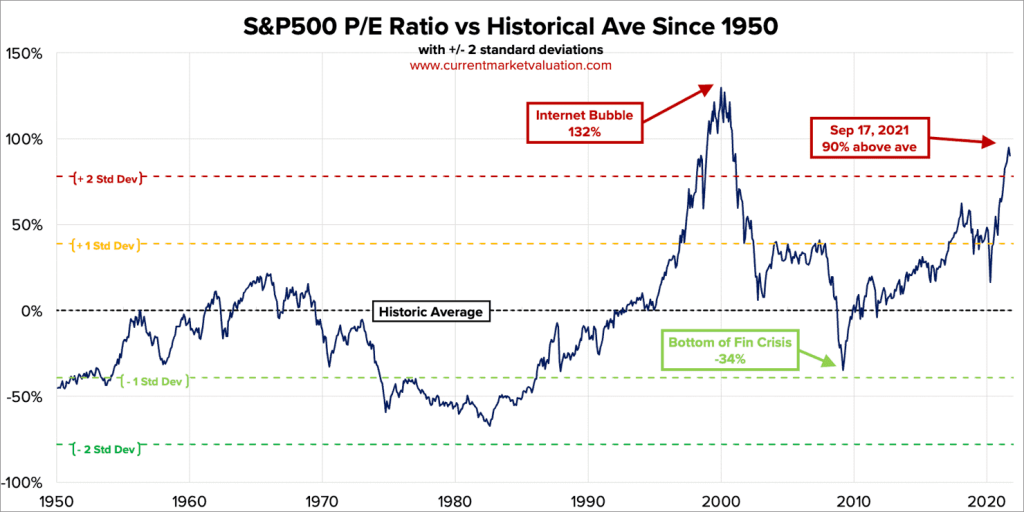
There are a multitude of ways to look at market value. Another indicator is the P/E ratio: the ratio of stock prices (P) to corporate profits (a.k.a. earnings = E). The market is not as high as the height of the dot-com bubble in 2000, but only the short sellers want to see a repeat of that size market crash.
The two big questions are (a) will the market have a big drop, as seen in the past when indicators get this far off the norm, and (b) will the Federal Reserve find a way to shrink its balance sheet back down to the sub-$1 trillion level it was before the Panic in 2007-2009? Maybe, for once, this time really is different?